IOS STUDY
[iOS_study] Swift Charts (#주식 차트, 주가) - BarMark
dev.lim
2023. 12. 30. 22:28

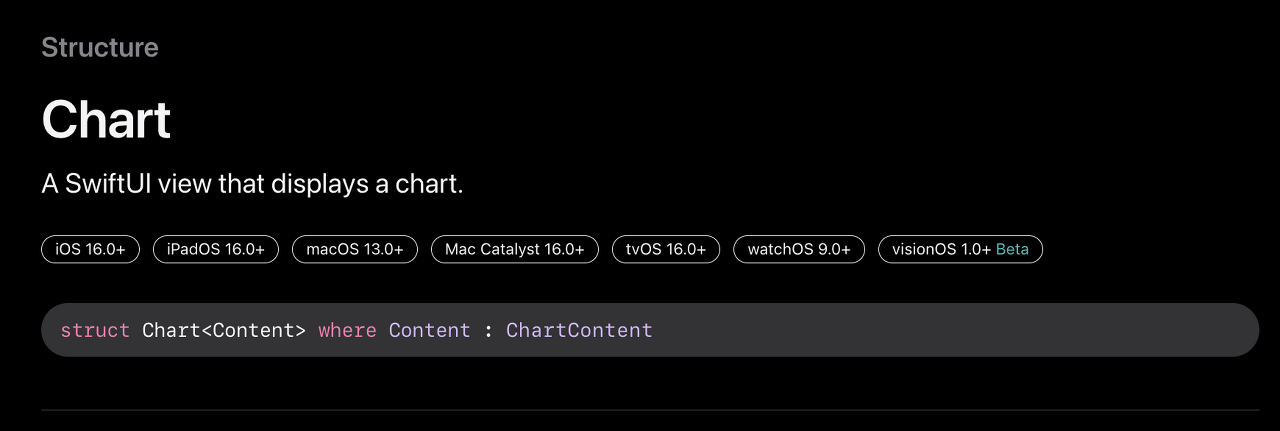
Swift Chart 개념
• iOS 16+에서 사용가능
• SwiftUI에서 제공하는 Chart를 사용하면 매우 쉽게 차트 그리기가 가능
Swift Chart 사용 방법
• import Charts로 모듈 import
struct ToyShape: Identifiable {
    var type: String
    var count: Double
    var id = UUID()
}
• data정의
struct ContentView: View {
var data: [ToyShape] = [
.init(type: "Cube", count: 5),
.init(type: "Sphere", count: 4),
.init(type: "Pyramid", count: 4)
]
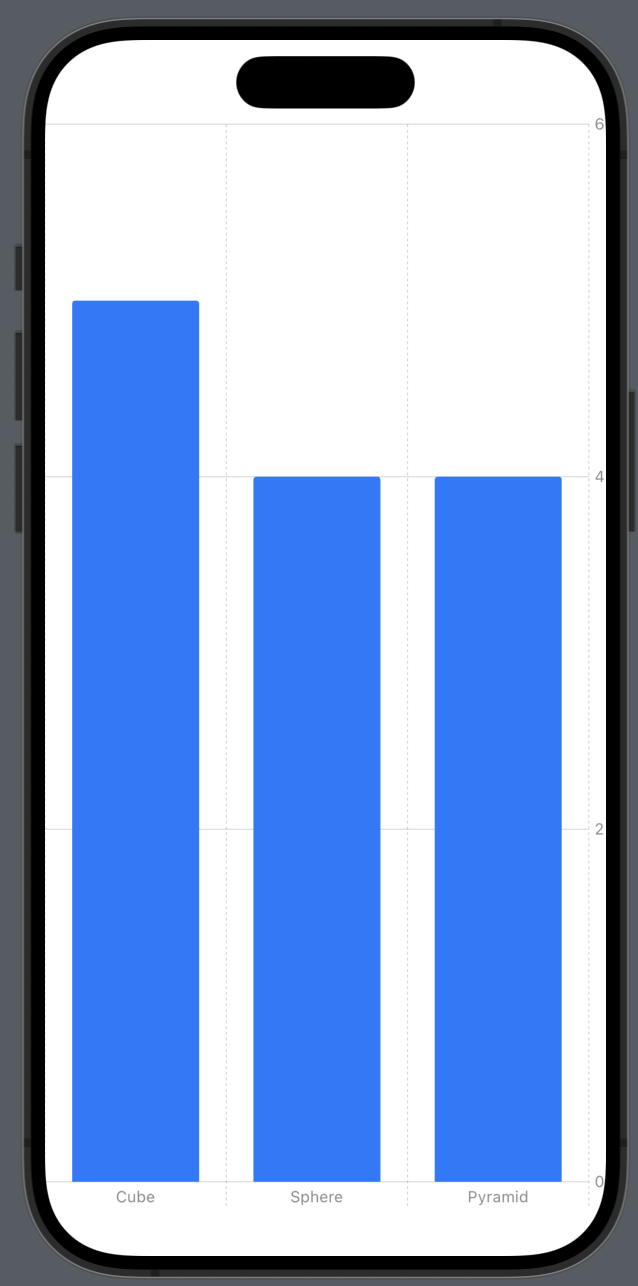
}• body에 뷰 구현
• Chart 블록 안에 BarMark를 삽입
• VarMark는 단순히 label, x, y 좌표가있는 형태
var body: some View {
        Chart {
            ForEach(data) { shape in
                BarMark(
                    x: .value("Shape Type", shape.type),
                    y: .value("Total Count", shape.count)
                )
            }
        }
    }
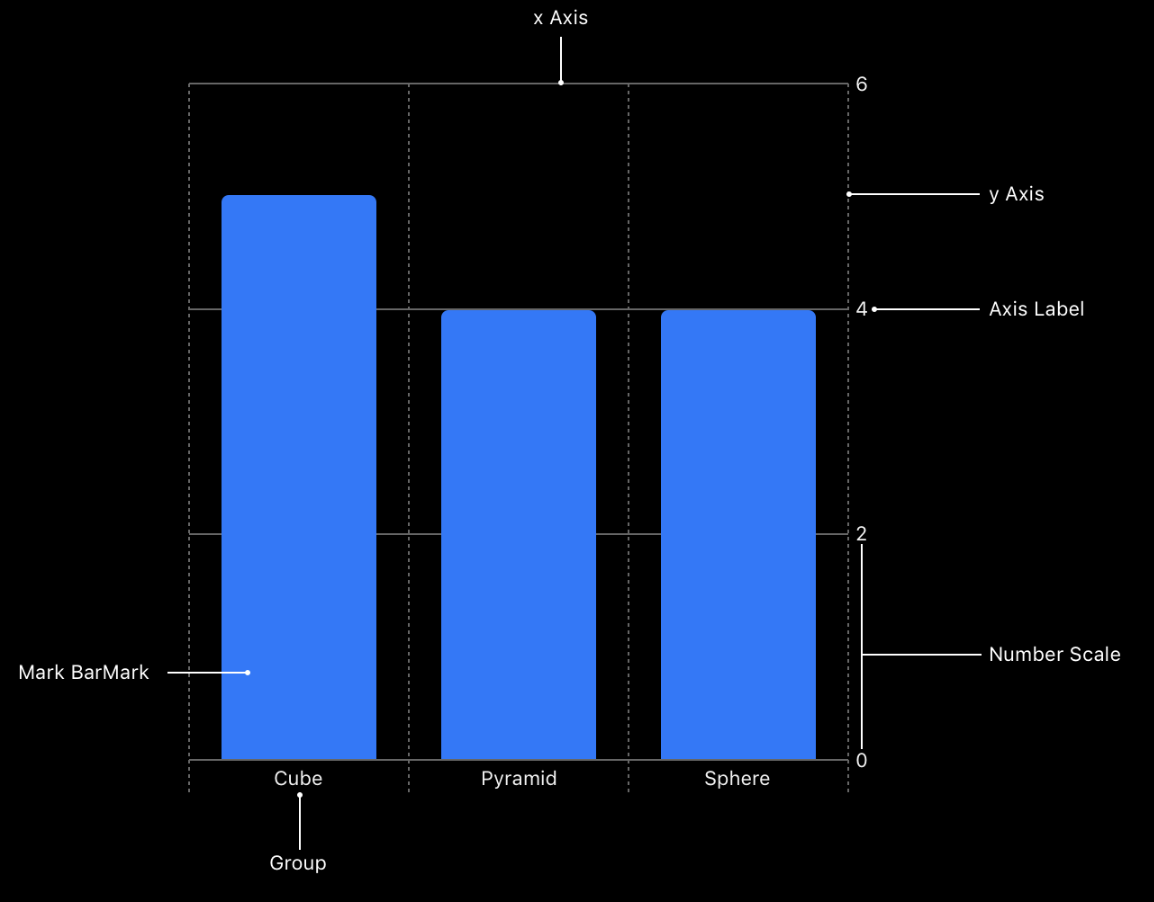
• 차트 구조
• 내부 코드로 인해 자동으로 Axis Label도 달아주는것이 포인트
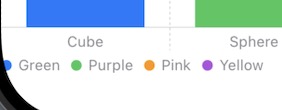
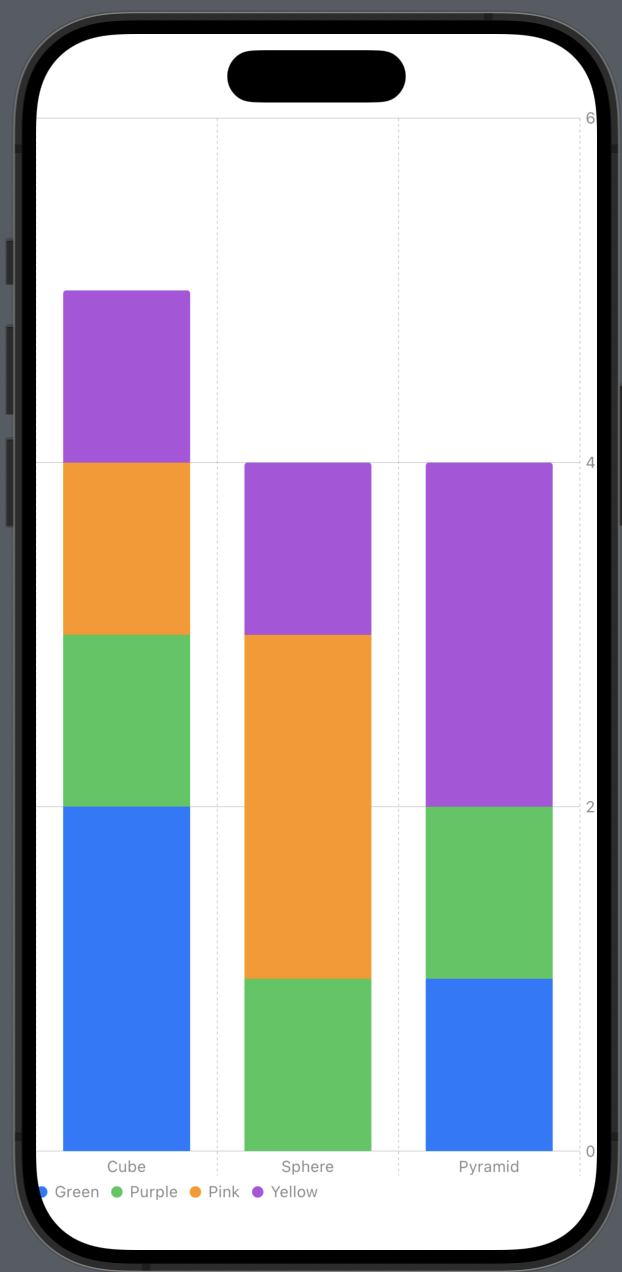
위에는 x좌표만 분류했지만 색상으로도 분류하고 싶은 경우?
• BarMark 블록에 foregroundStyle(by:) 메소드 사용
• by안에 들어가는 값은 .value("Shape Color", colorNameString) 와 같이 주입
ex)
• 모델에 color 추가
struct ToyShape: Identifiable {
    var color: String // <-
    var type: String
    var count: Double
    var id = UUID()
}
• data에 color 값 적용
var data: [ToyShape] = [
        .init(color: "Green", type: "Cube", count: 2),
        .init(color: "Green", type: "Sphere", count: 0),
        .init(color: "Green", type: "Pyramid", count: 1),
        .init(color: "Purple", type: "Cube", count: 1),
        .init(color: "Purple", type: "Sphere", count: 1),
        .init(color: "Purple", type: "Pyramid", count: 1),
        .init(color: "Pink", type: "Cube", count: 1),
        .init(color: "Pink", type: "Sphere", count: 2),
        .init(color: "Pink", type: "Pyramid", count: 0),
        .init(color: "Yellow", type: "Cube", count: 1),
        .init(color: "Yellow", type: "Sphere", count: 1),
        .init(color: "Yellow", type: "Pyramid", count: 2)
    ]
• BarMark에 foregroundStyle(by:) 추가
var body: some View {
    Chart {
        ForEach(data) { shape in
            BarMark(
                x: .value("Shape Type", shape.type),
                y: .value("Total Count", shape.count)
            )
            .foregroundStyle(by: .value("Shape Color", shape.color)) // <-
        }
    }
}
• value에 들어가는 shape.color를 설정하면 자동으로 색상 legend도 적용